Chapter 44: Class-Based Projects
MODULE 7 | WEEK 44
Chapter 44: Class-Based Projects
So far, in 3 chapters, you have learned concepts . The goal of this week is that you, in class, together with your instructor and classmates , use those same concepts in three small complete projects . For each project we give the problem (what to do), steps, checkpoints (what the correct result should be) and the rubric (how marks are awarded) . The code of the first project is complete ; the others give a structure and help and the rest of the work is yours.
TOPIC CHECKLIST (tick them off as you go)
-
☐ Class project method: pairs, commits, demo
-
☐ Project 1: Retail Sales Analytics (Spark ETL pipeline)
-
☐ Project 2: Cloud Data Lake (Raw, Clean, Curated)
-
☐ Project 3: Server Log Analysis (text parsing in Spark)
-
☐ Checkpoints and rubrics
-
☐ Preparing the README and demo
44.1 The Three Projects at a Glance
| Project | Goal | Tools | Time |
|---|---|---|---|
| 1. Retail Sales Analytics | Clean dirty data, calculate, store as Parquet, report | PySpark DataFrame/SQL, Parquet | 90-120 min |
| 2. Cloud Data Lake | Store data in zones in cloud storage and process it with Spark | S3 or Blob, IAM, PySpark | 90 min |
| 3. Server Log Analysis | Parse text logs to find errors and slow pages | PySpark, regexp_extract, window | 60-90 min |
44.2 Project 1: Retail Sales Analytics
Step 1: read the data and look at its condition.
from pyspark.sql import SparkSession, functions as F
from pyspark.sql.types import *
spark = (SparkSession.builder.appName("RetailProject")
.master("local[*]").getOrCreate())
schema = StructType([
StructField("order_id", IntegerType()), StructField("order_date", DateType()),
StructField("city", StringType()),      StructField("category", StringType()),
StructField("qty", IntegerType()),
StructField("unit_price", IntegerType()),
StructField("customer_id", IntegerType()),
])
raw = spark.read.csv("sales_dirty.csv", header=True, schema=schema)
print("Raw rows:", raw.count())
OUTPUT (sample) Raw rows: 5100
Step 2: clean it (write down the count after each step).
step1 = raw.dropDuplicates()                                   # duplicate rows
step2 = step1.dropna(subset=["city"])                          # empty city
clean = step2.filter(F.col("qty") > 0)                         # wrong qty
print("After dropping duplicates :", step1.count())
print("After dropping empty city :", step2.count())
print("After dropping wrong qty  :", clean.count())
clean = clean.withColumn("revenue", F.col("qty") * F.col("unit_price"))
OUTPUT (sample; first line: 5100 - 100 duplicates) After dropping duplicates : 5000 After dropping empty city : 4950 After dropping wrong qty : 4920
OUTPUT
4920
category
Laptop        482855000
Mobile        180811500
Watch          66188000
Headphones     24952500
Name: revenue, dtype: int64
Step 4: write to Parquet and read it back.
(clean.write.mode("overwrite")
      .partitionBy("category")
      .parquet("retail_curated"))
check = spark.read.parquet("retail_curated")
print(check.count())
OUTPUT (sample)4920 |
|---|
Step 5: report. Use toPandas() to bring out small results and make 2 charts (a bar chart by category, a line chart by month) and write a 5-line insight (for example "Laptop brings the most revenue but has fewer orders than Mobile").
| Deliverable | What to submit |
|---|---|
| Code | A notebook or.pythat runs from start to finish without errors |
| Data quality report | How many rows were removed and why (the counts from the 4 steps) |
| Charts + insights | 2 charts and a 5-line analysis |
| README | What you did, how to run it, what you learned |
| Rubric (Project 1) | Marks |
|---|---|
| Cleaning is correct and the count of every step is documented | 30 |
| All three questions answered correctly (verified with Pandas) | 30 |
| Parquet partitioning correct and read back | 15 |
| Charts and insight | 15 |
| Clean code and README | 10 |
| Total | 100 |
|---|
44.3 Project 2: Cloud Data Lake (Raw, Clean, Curated)
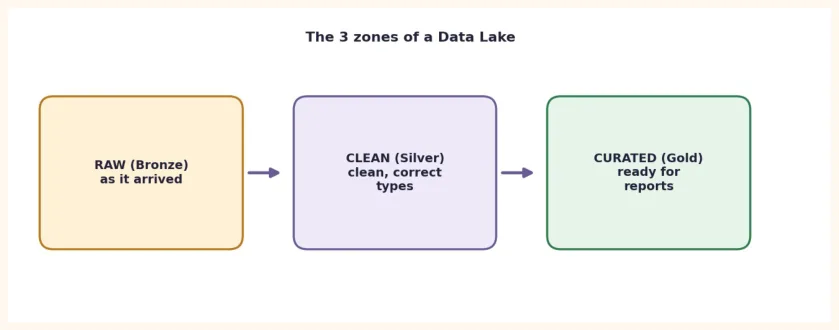
In this project you will run the Project 1 pipeline on the cloud . In a data lake, data is kept in 3 zones (Medallion pattern: Bronze/Silver/Gold ):
| Zone | What it holds | Rule |
|---|---|---|
| Raw (Bronze) | The data exactly as it arrived, never changed | Append only; never delete the old data. This is what gives you the confidence to reprocess. |
| Clean (Silver) | Clean, correct types, duplicates removed | Parquet |
| Curated (Gold) | Aggregates ready for reports/dashboards/ML | Parquet, columns with business names |
Steps (choose one of AWS or Azure):
-
Create a private bucket/container with the folders (prefixes)
raw/,clean/,curated/. -
sales_dirty.csv: upload it toraw/(usingboto3/azure-storage-blob, Chapter 43.6). -
Read
raw/with Spark (Colab or Databricks/EMR), run the cleaning from Project 1 and writeParquetto Parquet . -
clean/: read from it, build aggregates (category, city, month) and write them tocurated/. -
IAM/RBAC: create a read-only identity that can read only
curated/. Test that it cannot readraw/. -
Lifecycle rule:
raw/files older than 90 days go to a cheaper tier. -
Cost: write down your imaginary/real cost calculation; at the end delete everything and take a screenshot.
# Easy way to read from S3 in Colab: download with boto3, then read with Spark
import boto3, os
s3 = boto3.client("s3")             # keys come from the environment/`aws configure`
bucket = "my-sales-bucket-rania-123"
s3.download_file(bucket, "raw/sales_dirty.csv", "sales_dirty.csv")
# ... the cleaning from Project 1 ...
clean.write.mode("overwrite").parquet("clean_out")        # local folder
# upload it back (every file in the folder, in a loop)
for root, _, files in os.walk("clean_out"):
    for name in files:
        path = os.path.join(root, name)
        key = "clean/" + os.path.relpath(path, "clean_out")
        s3.upload_file(path, bucket, key)
44.4 Project 3: Server Log Analysis
The log files of websites are the most common example of Big Data: one line per request. We create a log file of 2000 lines (the OUTPUT is real) and use Spark to find errors, slow pages and the load by hour .
import random
from datetime import datetime, timedelta
random.seed(5)
pages = ["/home", "/cart", "/checkout", "/search", "/login"]
levels = ["INFO"] * 17 + ["WARN"] * 2 + ["ERROR"] * 1
t = datetime(2025, 3, 1, 9, 0, 0)
with open("server.log", "w") as f:
    for i in range(2000):
        t += timedelta(seconds=random.randint(1, 4))
        f.write(f"{t:%Y-%m-%d %H:%M:%S} {random.choice(levels)} "
        f"{random.choice(pages)} {random.randint(20, 900)}ms\n")
        print(open("server.log").read().splitlines()[0])
        print(open("server.log").read().splitlines()[1])
        print(sum(1 for _ in open("server.log")), "lines")
OUTPUT
2025-03-01 09:00:03 INFO /login 49ms
2025-03-01 09:00:07 INFO /home 180ms
2000 lines
logs = spark.read.text("server.log")                      # one column: "value"
pattern = r"^(\S+ \S+) (\w+) (\S+) (\d+)ms$"
parsed = logs.select(
    F.to_timestamp(F.regexp_extract("value", pattern, 1)).alias("ts"),
    F.regexp_extract("value", pattern, 2).alias("level"),
    F.regexp_extract("value", pattern, 3).alias("page"),
    F.regexp_extract("value", pattern, 4).cast("int").alias("ms"),
)
parsed.groupBy("level").count().orderBy(F.desc("count")).show()
parsed.groupBy("page").agg(F.round(F.avg("ms"), 1).alias("avg_ms")) \
      .orderBy(F.desc("avg_ms")).show()
Checkpoint (real OUTPUT): the same calculation directly in Python. Your Spark results should match these:
import re, collections
lv = collections.Counter()
pg = collections.defaultdict(list)
for line in open("server.log"):
    m = re.match(r"^(\S+ \S+) (\w+) (\S+) (\d+)ms$", line.strip())
    lv[m.group(2)] += 1
    pg[m.group(3)].append(int(m.group(4)))
    print(dict(lv))
    for p, v in pg.items():
        print(p, round(sum(v) / len(v), 1))
OUTPUT
{'INFO': 1683, 'WARN': 208, 'ERROR': 109}
/login 460.2
/home 457.4
/search 441.9
/cart 458.0
/checkout 465.0
Your task:
-
Errors per hour: Group by
F.date_trunc("hour", "ts")and count the ERRORs; name the worst hour. -
Slow requests: Count the rows with
ms > 800and find the slowest page. -
Error rate: compute the
ERROR / totalpercentage for each page and find the worst page. -
Window: within each page, compute the
msrunning average (rowsBetween(-50, 0)). -
Report: write in 5 lines what the engineering team should fix.
| Rubric (Project 3) | Marks |
|---|---|
| Parsing correct (regex) and schema with correct types | 30 |
| Answers to the four questions (matching the Python check) | 40 |
| Window function used correctly | 10 |
| Clarity of the report | 10 |
| Clean code | 10 |
| Total | 100 |
|---|
44.5 README and Demo
Every project needs a README.md . It is the face of your portfolio . Use the structure below:
# Project name
## Problem
One or two sentences: which question did you solve?
## Data
Where from, how many rows/columns, what was cleaned.
## Approach
Pipeline steps (a diagram is even better). Tools: PySpark, S3/Blob ...
## Result
Key numbers/charts and 3-5 insights.
## How to run 1. pip install pyspark 2. python make_data.py
3. python pipeline.py
## What I learned / next steps
What was difficult, and what you would do with more time.
| Demo (3 minutes) | What to show |
|---|---|
| 30 sec | The problem and the data |
| 90 sec | The code or pipeline running (live or recorded) |
| 45 sec | The result and insight |
| 15 sec | The biggest difficulty and what you learned |
44.6 Common Mistakes and Hands-on
Hands-on (extra)
-
In Project 1, add Region (the join from Chapter 42.7) and build a report by region.
-
In Project 1, write the rows with
price > 100000to a separate "premium" Parquet. -
In Project 2, write a table of the steps with the names of the other cloud (AWS or Azure) .
-
In Project 3, combine
WARNandERRORto compute a "problem rate".
KEY TAKEAWAYS
-
Project structure: problem -> data -> cleaning (documented) -> calculation -> result -> README -> demo.
-
Data lake zones: Raw (never change), Clean (clean Parquet), Curated (for reports).
-
Verify Spark results with another method (Pandas/SQL/Python) .
-
Least privilege when working on the cloud, and cleanup after the work .
-
Text logs: parse with
regexp_extract, then normal DataFrame operations. -
Git commits, README and demo are the mark of professional work.