Chapter 16: Clustering (K-Means, Hierarchical, DBSCAN)
MODULE 4 | WEEK 16
Chapter 16: Clustering (K-Means, Hierarchical, DBSCAN)
Ab tak har masle me hamare paas jawab (label) maujood tha. Magar aksar data aisa hota hai jis ka koi label nahi: ek dukaan ke 10,000 customers hain aur kisi ne nahi bataya ke kaun kis qism ka hai. Clustering (Unsupervised Learning) data me milti julti cheezon ke groups khud dhoondti hai.
16.1 Clustering kya hai?
Clustering kahan istemal hoti hai?
-
Customer segmentation: customers ko groups me bantna taake har group ke liye alag offer aur marketing ho.
-
Documents / news ka grouping: milte julte mazameen ek jagah.
-
Image compression: tasveer ke rang kam karna.
-
Anomaly detection: jo kisi group me na aaye wo shak wala hai (fraud).
-
Biology: milte julte genes ya mareezon ke groups.
ZAROOR YAAD RAKHO
Clustering me koi sahi jawab maujood nahi hota jis se muqabla karein. Isliye ye unsupervised hai, aur nateeja ka matlab insaan ko nikalna parta hai ("ye group shayad sasti cheezein dhoondne walon ka hai").
16.2 K-Means Clustering
Sab se mashhoor aur saada clustering algorithm. Pehle se batana parta hai ke kitne clusters (K) chahiye.
K-Means ke steps
-
K tay karo (maslan 3) aur data me se K random nuqtay (centroids) chun lo.
-
Har data point ko uske sab se qareeb centroid ke cluster me daal do.
-
Har cluster ka naya centroid nikalo (cluster ke saray points ka average).
-
Steps 2 aur 3 ko tab tak dohrao jab tak centroids hilna band na kar dein.
OUTPUT (chart)
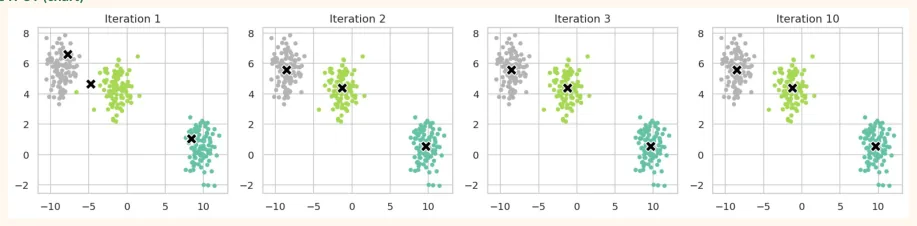
Kaale X centroids hain. Dekho kaise har iteration me wo apni jagah badal kar clusters ke beech me tik jate hain.
scikit-learn me K-Means
km = KMeans(n_clusters=3, n_init=10, random_state=42).fit(X)
print("Pehle 10 labels:", km.labels_[:10])
print("Centroids:")
print(km.cluster_centers_.round(2))
print("Har cluster me points:", np.bincount(km.labels_))
print("Inertia:", round(km.inertia_, 1))
OUTPUT
Pehle 10 labels: [1 2 2 1 0 2 1 0 2 1]
Centroids:
[[ 9.63  0.54]
 [-8.55  5.57]
 [-1.26  4.38]]
Har cluster me points: [100 100 100]
Inertia: 573.4
Naye points ka cluster batana
new_points = np.array([[0, 0], [-6, -8], [5, 5]])
print(km.predict(new_points))
OUTPUT
[2 2 2]
K kaise chunein? Elbow Method
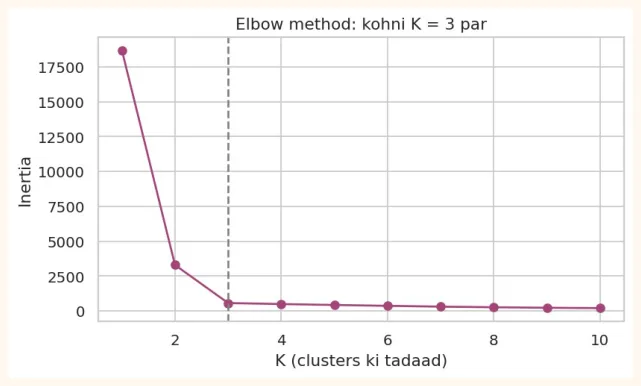
Inertia = har point ki apne centroid se doori ke squares ka jama (jitni kam, clusters utne tang). K barhane se inertia hamesha kam hoti hai (K = points ki tadaad par 0). Hum wo K dhoondte hain jahan inertia ka girna achanak dheema ho jaye: graph me kohni (elbow) ka mor.
inertias = []
for k in range(1, 11):
    inertias.append(KMeans(n_clusters=k, n_init=10, random_state=0).fit(X).inertia_)
print([round(i) for i in inertias])
OUTPUT
[18700, 3303, 573, 501, 435, 374, 315, 273, 235, 210]
plt.figure(figsize=(7, 3.8))
plt.plot(range(1, 11), inertias, marker="o", color="#A4457A")
plt.axvline(3, color="gray", linestyle="--")
plt.title("Elbow method: kohni K = 3 par")
plt.xlabel("K (clusters ki tadaad)")
plt.ylabel("Inertia")
plt.show()
OUTPUT (chart)
Silhouette Score: clustering kitni achhi hai?
Har point ke liye: apne cluster ke andar kitna qareeb (a) aur sab se qareeb doosre cluster se kitna door (b). Silhouette = (b - a) / max(a, b) .
-
+1 ke qareeb: point apne cluster me achhi tarah baitha hai, doosre se door.
-
0 ke qareeb: do clusters ki sarhad par.
-
Manfi: shayad ghalat cluster me.
from sklearn.metrics import silhouette_score
for k in range(2, 8):
    labels = KMeans(n_clusters=k, n_init=10, random_state=0).fit_predict(X)
    print(f"K = {k}: silhouette = {silhouette_score(X, labels):.3f}")
OUTPUT
K = 2: silhouette = 0.745
K = 3: silhouette = 0.790
K = 4: silhouette = 0.647
K = 5: silhouette = 0.471
K = 6: silhouette = 0.329
K = 7: silhouette = 0.349
Sab se zyada silhouette wala K behtareen hota hai (yahan K = 3, jo hamare asli data se mel khata hai). Elbow aur silhouette dono ko dekh kar K chuna jata hai.
K-Means ki zaroori shartein aur kamzoriyan
-
Features ko scale karna zaroori hai (kyunke ye doori par chalta hai).
-
Clusters ko gol aur taqreeban barabar size ka maan leta hai. Lambe ya ghumavdar clusters par nakam.
-
K pehle se batana parta hai.
-
Outliers centroid ko kheench dete hain.
-
Shuruaat par depend karta hai (isi liye n_init).
from sklearn.preprocessing import StandardScaler
np.random.seed(0)
# age (20-60) aur income (20,000-200,000): scale bohat alag
age = np.random.uniform(20, 60, 200)
income = np.random.uniform(20000, 200000, 200)
people = pd.DataFrame({"age": age, "income": income})
raw_labels = KMeans(n_clusters=3, n_init=10, random_state=0).fit_predict(people)
scaled = StandardScaler().fit_transform(people)
sc_labels = KMeans(n_clusters=3, n_init=10, random_state=0).fit_predict(scaled)
# Unscaled me age ka koi asar nahi: clusters sirf income se bante hain
print("Unscaled: age ka cluster me average farq:",
      people.groupby(raw_labels)["age"].mean().round(1).to_dict())
print("Scaled  : age ka cluster me average farq:",
      people.groupby(sc_labels)["age"].mean().round(1).to_dict())
OUTPUT
Unscaled: age ka cluster me average farq: {0: 41.0, 1: 39.2, 2: 39.8}
Scaled  : age ka cluster me average farq: {0: 46.8, 1: 46.8, 2: 27.1}
Unscaled me income ke numbers hazaron me hain aur age ke 20 se 60, isliye doori me sirf income hi nazar aati hai aur clusters me age ka farq zyada nahi dikhta. Scaling ke baad dono features barabar ahmiyat paate hain.
16.3 Hierarchical Clustering
K-Means me pehle K batana parta tha. Hierarchical Clustering ek shajra (family tree) banata hai jisme sab points ek ek karke jurtay jate hain, aur phir hum tay karte hain ke shajra ko kahan se kaatna hai.
Agglomerative (neeche se upar) tareeqa
-
Shuru me har point apna alag cluster hai.
-
Sab se qareeb ke do clusters ko jor do.
-
Ye dohrao jab tak sab ek cluster na ban jayen.
Do clusters ke darmiyan doori napne ke tareeqay ( linkage ):
| Linkage | Doori kaise | Khasusiyat |
|---|---|---|
| ward(aam default) | Jodne se cluster ke andar ka phailao kam se kam | Gol, barabar size ke clusters, aam taur par |
| badhe | behtareen |
| Linkage | Doori kaise | Khasusiyat |
|---|---|---|
| single | Do clusters ke sab se qareeb ke nuqtay | Lambay silsilay wale clusters, magar noise se |
| mutasir | ||
| complete | Sab se door ke nuqtay | Chhote, gol clusters |
| average | Sab jodiyon ka average | Darmiyana |
Dendrogram
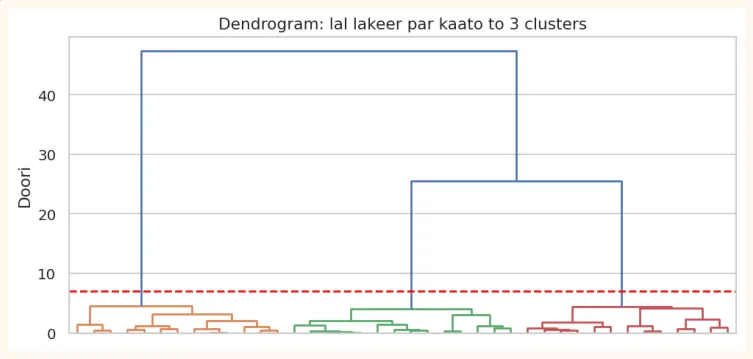
Shajra ki tasveer dendrogram kehlati hai. Neeche har point, aur upar jurte hue clusters. Khadi lakeer ki unchai batati hai ke do clusters kitne door the jab wo jude. Ek aadi lakeer se kaat do to us waqt jitne clusters bachte hain wohi hamare clusters hain.
from scipy.cluster.hierarchy import dendrogram, linkage, fcluster
Xs, _ = make_blobs(n_samples=40, centers=3, cluster_std=0.9, random_state=3)
Z = linkage(Xs, method="ward")
plt.figure(figsize=(9, 4))
dendrogram(Z, color_threshold=7, no_labels=True)
plt.axhline(7, color="red", linestyle="--")
plt.title("Dendrogram: lal lakeer par kaato to 3 clusters")
plt.ylabel("Doori")
plt.show()
OUTPUT (chart)
from sklearn.cluster import AgglomerativeClustering
agg = AgglomerativeClustering(n_clusters=3, linkage="ward").fit(Xs)
print("Cluster sizes:", np.bincount(agg.labels_))
print("scipy fcluster se bhi:", np.bincount(fcluster(Z, t=3, criterion="maxclust"))[1:])
OUTPUT
Cluster sizes: [13 13 14]
scipy fcluster se bhi: [13 14 13]
Faida: pehle se K batane ki zaroorat nahi, aur dendrogram se data ka poora structure nazar aata hai. Nuqsan: bare data (hazaron rows se zyada) par slow, aur ek bar jor diye gaye points wapas nahi tootte.
16.4 DBSCAN: density par mabni clustering
K-Means aur hierarchical gol clusters pasand karte hain. Magar asli data me clusters kisi bhi shakal ke ho sakte hain, aur noise bhi hota hai. DBSCAN (Density-Based Spatial Clustering of Applications with Noise) ghani abadi wale ilaqon ko cluster banata hai.
OUTPUT (chart)
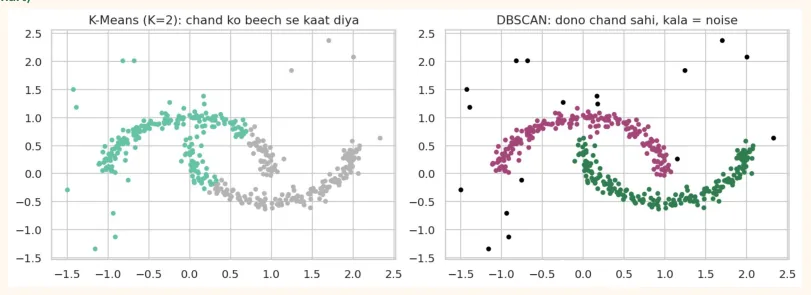
Faida: koi bhi shakal ke clusters, K batana nahi parta , aur noise khud pehchan leta hai. Nuqsan: eps aur min_samples chunna mushkil hai, aur jab clusters ki density alag alag ho to mushkil. Features ka scale yahan bhi zaroori hai.
eps chunne ka asaan tareeqa: k-distance plot
from sklearn.neighbors import NearestNeighbors
nn = NearestNeighbors(n_neighbors=6).fit(Xm)
dist, _ = nn.kneighbors(Xm)
kdist = np.sort(dist[:, -1])
print("6th padosi ki doori: median =", kdist[len(kdist)//2].round(3), "| 95th percentile =",
np.percentile(kdist, 95).round(3))
OUTPUT
6th padosi ki doori: median = 0.08 | 95th percentile = 0.174
Aam tareeqa: har point ki min_samples-wi padosi tak ki doori nikalo, unhein tarteeb me lagao aur graph me jahan achanak uchhal aaye wohi eps ke liye achha andaza hai. Upar ke numbers dikhate hain ke zyada tar points ki doori chhoti hai, aur kuch (noise) ki bohat zyada.
16.5 Teeno algorithms ka muqabla
| K-Means | Hierarchical | DBSCAN | |
|---|---|---|---|
| K batana parta hai? | Haan | Aakhir me kaat kar tay hota hai | Nahi (eps aur min_samples chahiye) |
| Cluster ki shakal | Gol | Zyada tar gol (linkage par) | Koi bhi shakal |
| Noise / outliers | Sambhal nahi sakta | Sambhal nahi sakta | Khud pehchanta hai |
| Bare data par | Tez | Slow | Darmiyana |
| Output | Seedhe labels | Poora shajra (dendrogram) | Labels aur -1 (noise) |
| Kab use | Bara data, gol groups | Chhota data, structure dekhna ho | Ajeeb shakal, noise wala data |
16.6 Mini Project: Customer Segmentation
Ek mall ke 300 customers ka synthetic (banaya hua) data: umar, salana aamdani, aur spending score (1 se 100, kitna kharch karte hain). Maqsad: customers ke groups dhoondna taake har group ke liye alag marketing ho.
rng = np.random.RandomState(10)
groups = [
    (rng.normal(25, 3, 70), rng.normal(35, 6, 70), rng.normal(75, 8, 70)),     # naujawan,
kam aamdani, zyada kharch
    (rng.normal(45, 5, 80), rng.normal(95, 10, 80), rng.normal(80, 7, 80)),    # ameer,
zyada kharch
    (rng.normal(50, 6, 80), rng.normal(90, 10, 80), rng.normal(22, 8, 80)),    # ameer, kam
kharch
    (rng.normal(30, 5, 70), rng.normal(30, 6, 70), rng.normal(25, 8, 70)),     # kam
aamdani, kam kharch
]
customers = pd.DataFrame({
    "age": np.concatenate([g[0] for g in groups]),
    "income_k": np.concatenate([g[1] for g in groups]),
    "spending": np.concatenate([g[2] for g in groups]),
}).clip(lower=1).round(1)
print(customers.shape)
print(customers.describe().round(1))
OUTPUT
(300, 3)
         age  income_k  spending
count  300.0     300.0     300.0
mean    38.1      64.8      50.1
std     11.0      32.0      28.1
min     19.1      13.1       6.1
25%     27.4      32.4      23.1
50%     40.0      78.2      44.8
75%     47.2      95.2      78.6
max     63.5     121.8      96.7
Step 1: Scale karo aur K chuno
from sklearn.preprocessing import StandardScaler
Xc = StandardScaler().fit_transform(customers)
for k in range(2, 8):
    lab = KMeans(n_clusters=k, n_init=10, random_state=0).fit_predict(Xc)
    print(f"K = {k}: inertia = {KMeans(n_clusters=k, n_init=10,
random_state=0).fit(Xc).inertia_:7.1f} | silhouette = {silhouette_score(Xc, lab):.3f}")
OUTPUT
K = 2: inertia =   386.5 | silhouette = 0.531
K = 3: inertia =   212.9 | silhouette = 0.586
K = 4: inertia =    89.6 | silhouette = 0.659
K = 5: inertia =    77.0 | silhouette = 0.580
K = 6: inertia =    67.0 | silhouette = 0.520
K = 7: inertia =    57.5 | silhouette = 0.434
Step 2: Model aur har group ko samajhna
final = KMeans(n_clusters=4, n_init=10, random_state=0).fit(Xc)
customers["segment"] = final.labels_
profile = customers.groupby("segment").agg(
    customers=("age", "count"),
    avg_age=("age", "mean"),
    avg_income_k=("income_k", "mean"),
    avg_spending=("spending", "mean"),
).round(1)
print(profile)
OUTPUT
         customers  avg_age  avg_income_k  avg_spending
segment
0               80     49.4          90.6          22.3
1               80     45.0          96.6          79.5
2               70     30.0          28.5          23.7
3               70     25.3          35.5          74.7
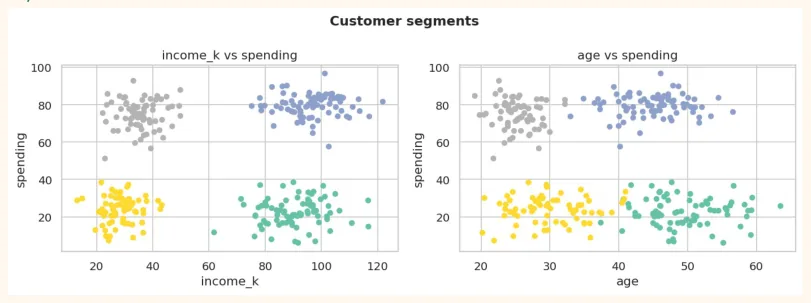
fig, axes = plt.subplots(1, 2, figsize=(11, 4))
for ax, (a, b) in zip(axes, [("income_k", "spending"), ("age", "spending")]):
    sc = ax.scatter(customers[a], customers[b], c=customers["segment"], cmap="Set2", s=22)
    ax.set_xlabel(a)
    ax.set_ylabel(b)
    ax.set_title(f"{a} vs {b}")
fig.suptitle("Customer segments", fontsize=13, fontweight="bold")
plt.tight_layout()
plt.show()
OUTPUT (chart)
Step 3: Har segment ko naam do aur plan banao
Clustering ka asli faida tab hai jab hum har group ko maani dein. Upar profile table dekh kar (har segment ke average umar, aamdani aur kharch) apne alfaz me naam likho. Misaal ke taur par:
-
Kam aamdani, zyada kharch wale naujawan: installments aur student discounts.
-
Ameer aur zyada kharch karne wale: loyalty program aur premium products.
-
Ameer magar kam kharch karne wale: yahan sab se bara mauqa hai, un ko mutawajjih karne wale offers.
-
Kam aamdani, kam kharch: sasti cheezein, sale ke mauqay par ishtihar.
AAM GALTIYAN
-
Features ko scale kiye baghair clustering (khaaskar K-Means aur DBSCAN).
-
Clustering ke nateeje ko sahi jawab samajhna. Ye sirf ek tarah ka grouping hai.
-
Elbow me kohni na dikhe to bhi zabardasti K chun lena. Silhouette aur domain knowledge bhi use karo.
-
Text columns (categories) par seedha K-Means lagana (pehle encode karo, ya K-Modes jaisa algorithm).
-
K-Means ko lambay ya ghumavdar clusters par lagana. Wahan DBSCAN ya hierarchical behtar hota hai.
-
DBSCAN me eps random chun lena. k-distance plot se andaza lagao.
16.7 Hands-on
from sklearn.datasets import load_iris
iris_X = load_iris(as_frame=True).data
iris_y = load_iris().target                   # asli species (clustering me istemal nahi
hongi)
iris_s = StandardScaler().fit_transform(iris_X)
lab = KMeans(n_clusters=3, n_init=10, random_state=0).fit_predict(iris_s)
print(pd.crosstab(iris_y, lab, rownames=["Asli species"], colnames=["Cluster"]))
OUTPUT
Cluster        0   1   2
Asli species
0              0  50   0
1             39   0  11
2             14   0  36
-
Iris par K-Means: upar crosstab dekho. Kaunsi species saaf alag hui aur kaunsi do species mix ho gayin?
-
Elbow aur silhouette: Iris par K = 2 se 8 tak dono nikalo. Silhouette sab se zyada K = 2 par aaye to kyun? (Hint: do species aapas me bohat qareeb hain)
-
Hierarchical: Iris ka dendrogram (ward linkage) banao aur 3 clusters ka crosstab dekho.
-
DBSCAN: Iris (scaled) par eps 0.3 se 1.0 tak badal kar clusters aur noise points ki tadaad dekho.
-
Customer segmentation: 16.6 me K = 3 aur K = 5 aazmao aur dekho kaunsa segmentation business ke liye zyada kaam ka hai.
KEY TAKEAWAYS
-
Clustering unsupervised hai: label ke baghair data me milti julti cheezon ke groups dhoondna. Koi sahi jawab nahi, matlab insaan nikalta hai.
-
K-Means: K centroids chuno, points ko qareeb centroid se jodo, centroid naye banao, dohrao. Scaling zaroori, K pehle batana parta hai.
-
K chunne ke liye Elbow method (inertia) aur Silhouette score (+1 behtar, 0 sarhad).
-
Hierarchical: shajra banata hai (dendrogram), K baad me kaat kar tay hota hai. ward linkage aam taur par behtareen.
-
DBSCAN: ghani ilaqon ko cluster banata hai, koi bhi shakal, noise khud pehchanta hai (label -1). eps aur min_samples chahiye.
-
Customer segmentation clustering ka sab se aam istemal hai. Segments ko maani naam dena data scientist ka kaam hai.